
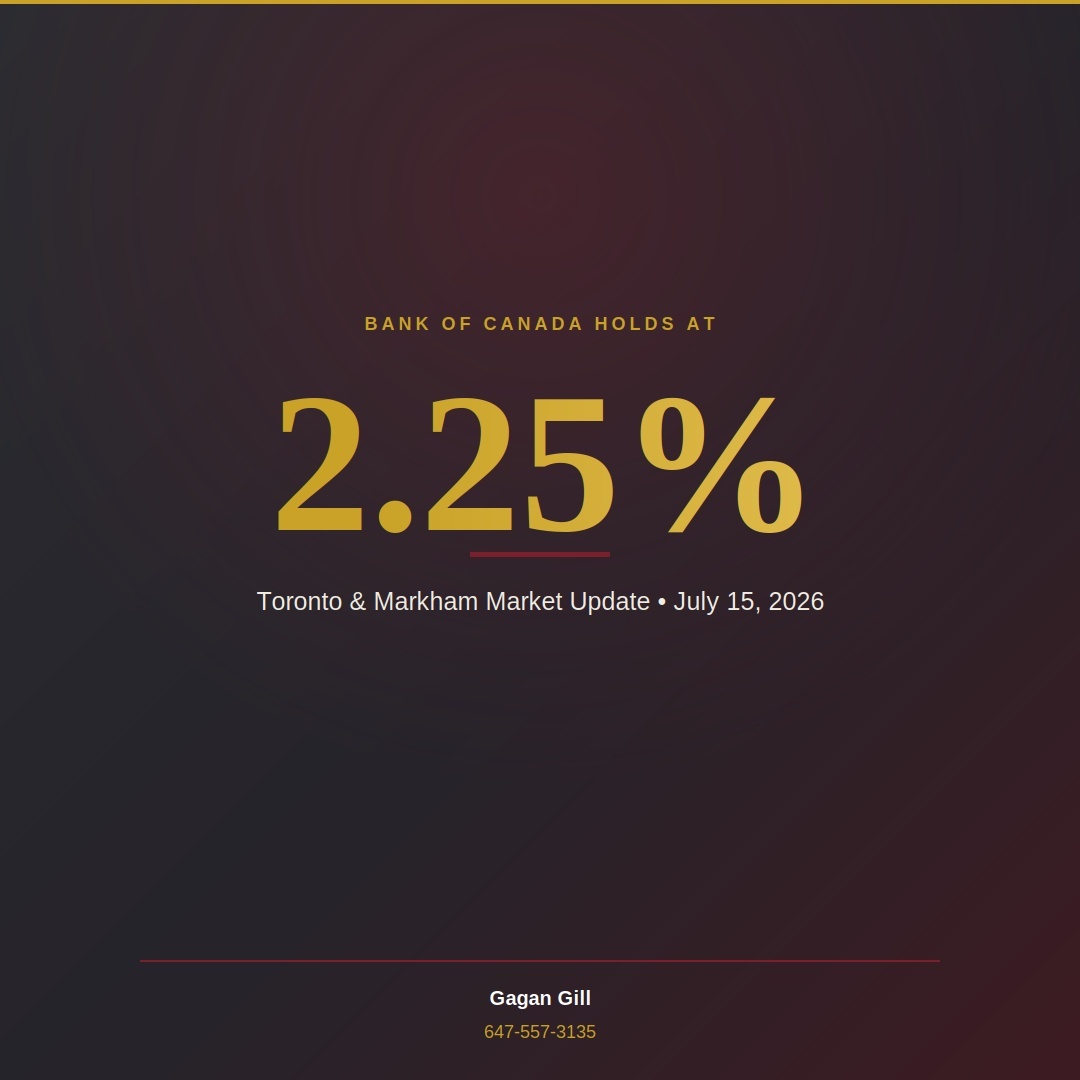
The Bank of Canada held its policy rate at 2.25% today, July 15, 2026 — the sixth consecutive hold since its last cut in October 2025. On its own, a hold is just a headline. Paired with the Toronto Regional Real Estate Board's June 2026 Market Watch data, it tells a much more specific story about where Toronto and Markham real estate stand right now, and why the statistics currently favour buyers who move rather than wait.
📅 Book a Free Consultation 🏡 Explore the Zero Down ProgramOr reach me directly at 647-557-3135
Key Takeaways
- Rate: Bank of Canada policy rate held at 2.25% for the sixth straight decision (Dec 2025 – Jul 2026).
- Sales: GTA home sales rose 9.4% year-over-year in June 2026, while new listings fell 12.9%.
- Prices: The average GTA selling price was $1,058,658 in June 2026, down 3.9% YoY — but the pace of decline has been shrinking for months.
- Markham: Semi-detached and attached homes are the most resilient segment, down just 6.40% YoY versus a 11.51% drop for townhouses.
- Mortgage rates: Best available 5-year fixed is 3.94% and 5-year variable is as low as 3.35% (Ratehub.ca, July 2026), with prime holding at 4.45%.
- Toronto vs. Markham: The City of Toronto is currently more resilient than Markham, with prices down just 4.33% YoY citywide versus 7.59% in Markham.
In This Article
How We Got to 2.25%
It's easy to forget how far rates have moved in just a few years. The Bank of Canada raised its policy rate 10 times through 2022 and 2023, taking it to a peak of 5.00% by mid-2023. After holding there for about a year, the Bank pivoted and cut rates nine times between June 2024 and October 2025, bringing the policy rate down to today's 2.25%. Since then, the Bank has held steady through six straight decisions: December 10, 2025, January 28, March 18, April 29, June 10, and now July 15, 2026.
Source: Bank of Canada policy interest rate announcements, 2023–2026.
What's Driving Today's Decision
The Bank is navigating two forces pulling in opposite directions. Headline inflation jumped to 3.2% in May — the first time above 3% since late 2023 — driven mostly by oil prices tied to the conflict in the Middle East. At the same time, Canada's economy contracted in the first quarter before rebounding with 0.5% GDP growth in April. Core inflation measures, which strip out volatile energy costs, have stayed closer to 2%, giving the Bank room to look past the near-term price shock rather than react to it with rate hikes.
Mortgage & Prime Rates Right Now
Today's hold means the borrowing costs Ontario buyers are already working with stay unchanged. Here are the best available rates in Ontario as of July 12–13, 2026, per Ratehub.ca:
| Term | Type | Best Rate | Provider |
|---|---|---|---|
| 2-Year | Fixed | 3.89% | Big 6 Bank |
| 3-Year | Fixed | 3.89% | Big 6 Bank |
| 4-Year | Fixed | 4.09% | Big 6 Bank |
| 5-Year | Fixed | 3.94% | Ratehub.ca Exclusive |
| 1-Year | Fixed | 4.59% | Scotiabank |
| 5-Year | Variable (best available) | 3.35% | — |
Source: Ratehub.ca, Current Mortgage Rates Ontario, updated July 12–13, 2026.
| Benchmark Rate | Current Value |
|---|---|
| Bank of Canada Overnight Rate | 2.25% |
| Prime Rate (Canada) | 4.45% |
Source: Ratehub.ca / Bank of Canada, as of July 13, 2026.
The practical upshot: since these benchmarks haven't moved in six straight rate announcements, buyers who got pre-approved months ago are still shopping against the same math today — no rush to requalify, no surprise stress-test shift. And with the best available 5-year fixed rate at 3.94% and variable options as low as 3.35%, actual borrowing costs are meaningfully better than the posted "sticker" rates many buyers assume they're stuck with.
The GTA Market By the Numbers
While rates have sat still, Greater Toronto's housing market has been anything but. TRREB's June 2026 Market Watch shows real momentum building:
GTA Home Sales, June 2026
6,770 ↑ 9.4% YoY
New Listings, June 2026
17,282 ↓ 12.9% YoY
Active Listings, June 2026
27,329 ↓ 13.5% YoY
Avg. Selling Price, June 2026
$1,058,658 ↓ 3.9% YoY
That combination — more sales, fewer new listings, and a shrinking pool of active inventory — is the classic setup for tightening conditions. The MLS® HPI Composite benchmark was down 5.4% year-over-year in June, though TRREB's own economists note the annual rate of decline has been shrinking for months. Homes are also moving faster: average days on market for sold listings sat at 29 days in June 2026, in line with recent norms. TRREB's leadership has been direct about what comes next: after a slow start to 2026, the second half of the year is expected to bring more competition between buyers and, eventually, renewed price growth as conditions catch up with 2025 levels.
Source: TRREB Market Watch, June 2026.
Markham Prices by Home Type
Zooming into Markham specifically, not every home type is correcting at the same speed. Here's the MLS® HPI benchmark price and year-over-year change by category for June 2026:
| Home Type | Benchmark Price | YoY Change |
|---|---|---|
| Detached | $1,464,200 | -7.53% |
| Semi-Detached / Attached | $1,048,800 | -6.40% |
| Composite (All Types) | $1,067,000 | -7.59% |
| Townhouse | $710,400 | -11.51% |
| Condo Apartment | $532,000 | -10.22% |
Source: TRREB Market Watch, June 2026, MLS® Home Price Index.
Toronto vs. Markham: How Do They Compare?
If you're weighing the city against the suburbs, the June 2026 numbers tell a clear story: the City of Toronto is currently the more resilient market, outperforming Markham in every single home type category.
| Home Type | Toronto YoY | Markham YoY |
|---|---|---|
| Composite (All Types) | -4.33% | -7.59% |
| Detached | -4.77% | -7.53% |
| Semi-Detached / Attached | -4.06% | -6.40% |
| Townhouse | -6.83% | -11.51% |
| Condo Apartment | -7.64% | -10.22% |
Source: TRREB Market Watch, June 2026, MLS® Home Price Index, City of Toronto and Markham.
Where York Region Is Strongest Right Now
Comparing MLS® HPI Composite year-over-year change across York Region shows Markham performing roughly mid-pack — softer than Vaughan or Stouffville, but firmer than Newmarket or Richmond Hill.
Source: TRREB Market Watch, June 2026, MLS® Home Price Index by municipality.
5 Statistical Reasons This Is a Strong Time to Buy
Rate stability is real and measurable. Six consecutive holds mean your pre-approval and stress-test math aren't shifting under you while you shop — a rare stretch of predictability after 2022–2023's constant moves.
Demand is already accelerating. GTA sales are up 9.4% year-over-year, the clearest sign yet that buyers are re-entering the market ahead of any rate cut.
Supply is shrinking fast. New listings are down 12.9% and active listings down 13.5% year-over-year — less competition to choose from, but also less competition among sellers negotiating with you.
The price gap is closing. Prices are still down 3.9% year-over-year, but the pace of decline has been shrinking for months. Buyers who wait for headlines to turn positive are typically buying after the discount has already disappeared.
Selective opportunity still exists. Markham townhouses (-11.51% YoY) and condo apartments (-10.22% YoY) are still pricing well below the resilient detached and semi-detached segments — a window that tends to close once sales momentum fully catches up to falling supply.
Frequently Asked Questions
What is the Bank of Canada's policy rate as of July 15, 2026?
The Bank of Canada held its policy rate at 2.25% on July 15, 2026, marking the sixth consecutive hold since the Bank's last rate cut in October 2025.
How high did interest rates get in this cycle, and how far have they fallen?
The Bank of Canada's policy rate peaked at 5.00% in mid-2023 after ten consecutive hikes. Nine rate cuts between June 2024 and October 2025 brought it down to 2.25%, where it has remained since.
What is the current 5-year fixed mortgage rate in Ontario?
As of July 2026, the best available 5-year fixed mortgage rate in Ontario is 3.94%, with the best 5-year variable rate as low as 3.35%, according to Ratehub.ca. Canada's prime rate stands at 4.45%.
Is Toronto or Markham a better real estate market right now?
As of June 2026, the City of Toronto is more resilient, with prices down 4.33% year-over-year citywide compared to 7.59% in Markham. However, Markham's benchmark prices remain lower in absolute terms for comparable home types, and its softer correction in townhomes and condos offers more negotiating room for buyers.
Which Markham home type is holding its value best?
Semi-detached and attached homes are the most resilient segment in Markham, down just 6.40% year-over-year in June 2026, compared to a 11.51% decline for townhouses and 10.22% for condo apartments.
Is now a good time to buy in the GTA?
TRREB's June 2026 data shows rising sales, falling new listings, and shrinking active inventory — conditions that typically precede price growth. Combined with a stable rate environment, many buyers are finding this a more predictable window than the volatility of recent years, though individual circumstances vary.
Let's Talk About Your Numbers
Whether you're pre-approved and ready to move or just want to understand what today's decision means for your specific budget, I'm happy to walk through it with you.
📅 Book a Free Consultation 🏡 Explore the Zero Down ProgramOr reach me directly at 647-557-3135
Rate figures and Bank of Canada history are based on publicly available Bank of Canada announcements. Mortgage rates are sourced from Ratehub.ca, updated July 12–13, 2026, and are subject to change — confirm current rates directly with a lender or mortgage broker before relying on them. Market statistics, and Markham/York Region MLS® HPI figures are sourced from the Toronto Regional Real Estate Board's Market Watch, June 2026, reported at the municipal/regional level. This content discusses market conditions and general considerations only, not individualized financial or mortgage advice — please confirm your options with a licensed mortgage professional.

 Toronto Real Estate Board (TRREB); All information deemed reliable but not guaranteed. All properties are subject to prior sale, change or withdrawal. Neither listing broker(s) or information provider(s) shall be responsible for any typographical errors, misinformation, misprints and shall be held totally harmless. Listing(s) information is provided for consumer's personal, non-commercial use and may not be used for any purpose other than to identify prospective properties consumers may be interested
